If you prefer to browse a book instead of this (huge) page you can buy the 1$ Kindle book by C.Chantrill "US Government Spending: History, Facts and Charts of Spending, Taxes and Debt, Federal, State and Local, 2015 Edition".
Last, but not least, you might be interested in reading how Central banking and haute finance have grown at the expense of the people.
..: Updated Daily :..
Shortcuts to: Main aggregates - GDP and debt - Debt holders - Deficits and defense spending - Monetary policy
______________________________
The United States Debt Dashboard
Budget, Spending and Debt Holders
1. Introduction: Main Aggregates of the United States Total and Public Debts
U.S. Total Credit Market debt owed (public + household + corporate)
- Total TCMDO = debt owed by domestic financial sector + domestic non financial sector + rest of the world financial sector (the latter includes U.S. international transactions accounts (ITAs) and the U.S. international investment position (IIP) )

(discontinued TCMDO)

reconstructed TCMDO (source);
Since 2016 Q4, U.S. total credit market debt owed is over US$ 66 Trillion.

(!) Data series since 1951; Updated quarterly ;
This amount does not include Corporate equities ($36.8 tn in 2015 Q2) and Mutual fund shares ($13.1 tn). Source, tables L.223/224.
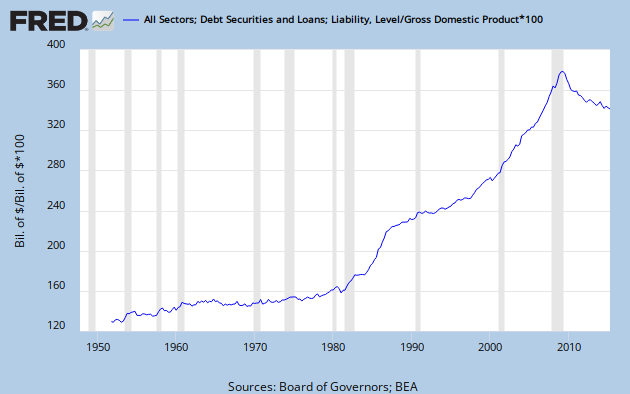
- Total credit market debt owed over GDP (in %)
Data serie since 1951; Updated quarterly; discontinued

Data serie since 1951; Updated quarterly

Total credit market debt owed over GDP (in %);
Data serie between 1870 and 2009

Private and Public Debts to GDP ratios; Data series 1920-2011
Data serie since 1951 ; Updated quarterly ; discontinued
Debt owed (TCMDO) = Assets held (TCMAH) = Total Credit Market Assets Held by Domestic Nonfinancial Sectors (TCMAHDNS, green line) + Held by Foreign Sectors (WCMITCMAHDNS, red line) + Held by Domestic Financial Sectors (TCMAHDFS, blue line)


Data serie 1929-2008
- Share (in %) of the UST debt held by foreign sector over total US Treasuries debt owed (GFDEBTN)

Data serie since 1966 ; Updated quarterly
- Share (in %) of the credit market debt held by foreign sector over total credit market debt owed
Data serie since 1951 ; Updated quarterly
U.S. Total Public Debt (Local + State + Federal)
data series 1917-1968, monthly data; source

(discontinued)
Data series since 1966; Updated quarterly; charted as yearly average
In 2015 Q2, this amount reached US$ 21.1 Trillion.

(discontinued)
Data series since 1946 and 1966;
Updated yearly (using average of quarterly data)
- How close to an exponential trend is the growth of Total Public Debt?


Source: Conscience-Sociale.org, using Fed data till 2013 Q1
Share (in %) of total public debt over the total credit market debt owed;
Data series since 1950 and 1966; updated yearly and quarterly

Share (in %) of the Total US Public Debt over the value of all of the Gold mined in the world (here assumed to be constant 5,507,423,475 Troy Ounces); Data serie since 1968; Updated quarterly
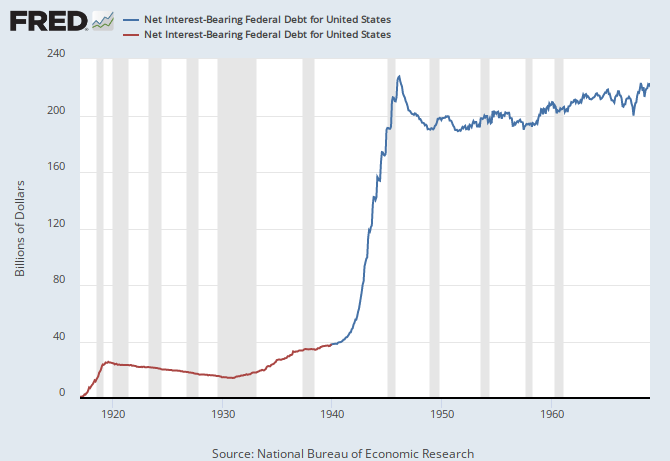
U.S. Debt service: interest payments
These data published by the B.E.A. may be not updated because of some US government shutdown.
The interest payments on the debt outstanding was USD 360 billion in FY 2012 (454 in FY2011), and this amount is sharply increasing to $743 bn in the budget planned for FY 2022 :
The interest payments on the debt outstanding was USD 360 billion in FY 2012 (454 in FY2011), and this amount is sharply increasing to $743 bn in the budget planned for FY 2022 :


"Government interest payments A180RC1" (incl. Federal+State+Local interest payments); data series since 1929, updated yearly, NSA
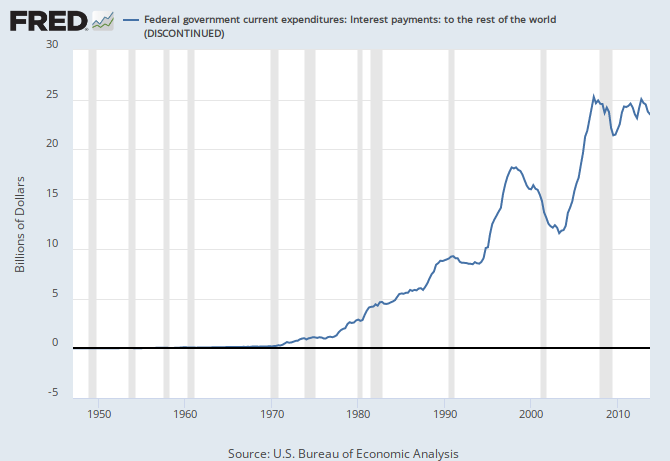
Federal Government Interest payments to the rest of the world since 1947, updated quarterly, NSA
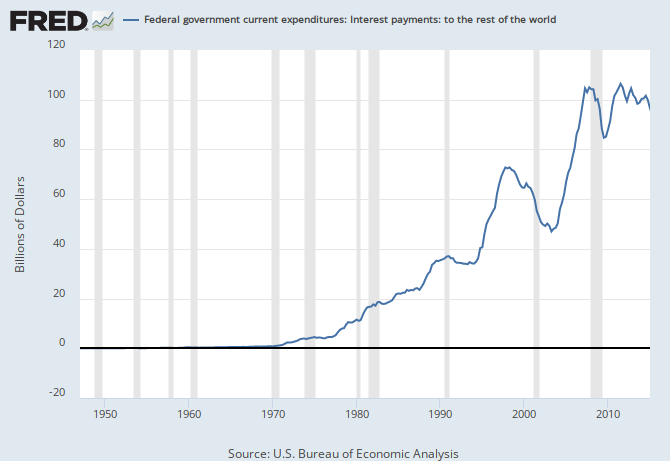
Government Interest payments to the rest of the world since 1947,
updated quarterly, Seasonally Adjusted Annual Rate

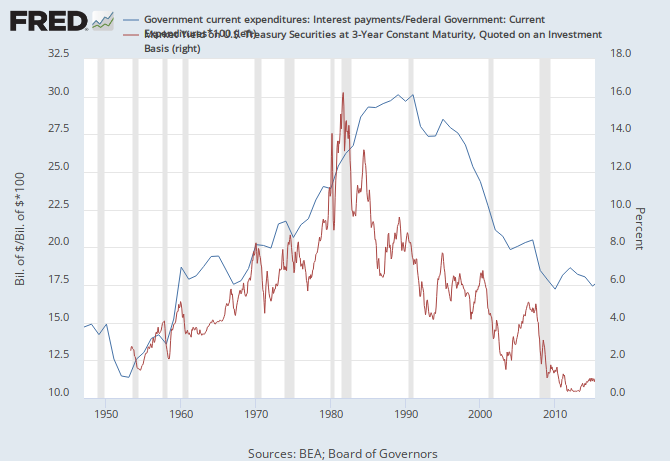
Share of government interest payments to the total government spendings; data series since 1947 (%, lhs); 3Y UST rate since 1953 (rhs); Updated yearly and monthly

U.S. Federal Government Interest Payments as a Percentage of Tax Revenues; data serie since 1947; updated quartertly

Interest (% GDP) paid because of :
bleu : Debt owed by State gov
red : Debt owed by Local gov
bleu : Debt owed by State gov
red : Debt owed by Local gov
green : Debt owed by Federal government
U.S. Total Public Debt per person
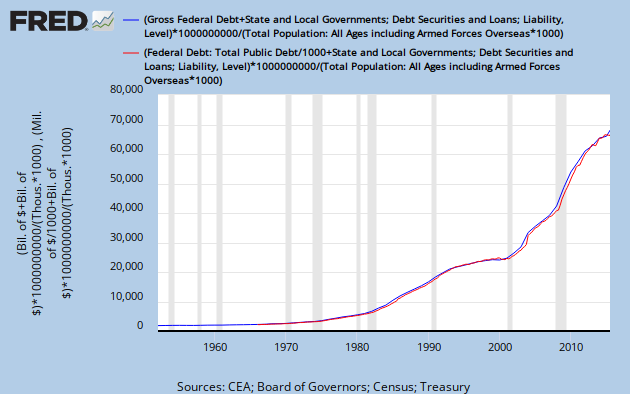
Data series since 1952 and 1966; updated yearly and quarterly;
Since 2015 Q1, U.S. total public debt per person is over US$ 65,000.
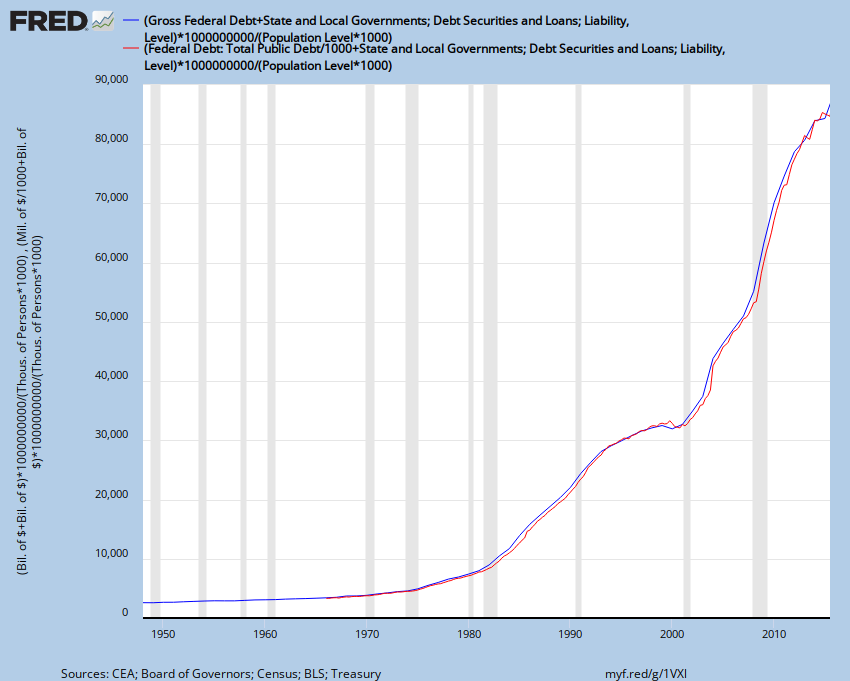
Data series since 1948 and 1966; updated yearly and quarterly;
Since 2015 Q1, U.S. total public debt per population in working-age* is over US$ 84,000.
* Working-Age Population as defined for the U.S. = Total Noninstitutionalized Civilian Population; Includes working teens 16 years old and over; Excludes kids, military personnel, people in jail.
U.S. Federal Government Total Public Debt, and debt ceiling
- Federal Total Public Debt (GFDEBTN) is the total debt owed by the United States federal government.
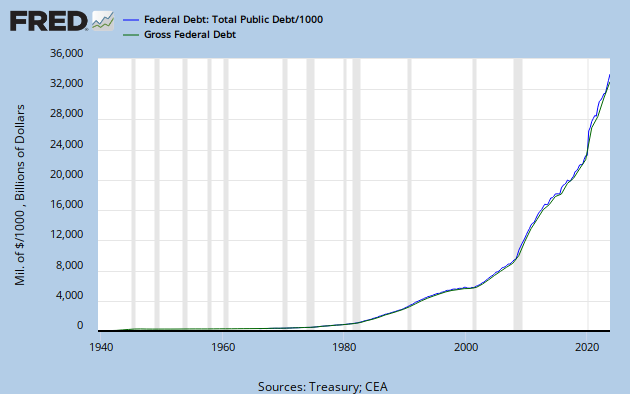
Data series since 1939 and 1966; Updated yearly and quarterly ;
In 2015 Q1, Federal Total Public Debt reached US$ 18.1 Trillion.
As of 6/10/2015, total public debt outstanding reached US$ 18.1 Trillion
- How close to an exponential trend is the growth of GFDEBTN ?


Source: Conscience-Sociale.org, using Fed data till 2013 Q1
- Gross Federal Debt is forecast to grow from USD 16.05 trillion in 2012 to USD 26.08 trillion in 2023 (source: CBO, Feb. 2013 version, “The Budget and Economic Outlook: 2013 to 2023”, table 1.6) : an increase of +62.5 % !

- Federal Total Public Debt can be split into:
It is composed by US Treasury securities plus budget agency securities and federal mortgage debt.
and b) “debt held by federal government accounts" (FDHBATN, US$ 5.1 trillion in Q1 2015; $4.94 trillion on 11/13/2013); These Intragovernmental Holdings are mostly made up of the Government Account Series (GAS) held by government trust funds, revolving funds, and special funds such as IOUs owed to the Social Security Trust Fund.

Share (in %) of gross federal debt over the total credit market debt owed ;
Data series since 1950 and 1966; Updated yearly and quarterly
- Federal debt held by the public (FYGFDPUN) is forecast to grow from USD 11.28 trillion in Q3 2012 to USD 19.94 trillion in Q4 2023 (source: CBO, Feb. 2013 version, “The Budget and Economic Outlook: 2013 to 2023”, table 1.6) : an increase of +76.7 % !
- Debt distribution (securities types) monthly graphs for principal and interests, and marketable vs non-marketable securities monthly graphs.
- What kind of political control does a U.S. debt ceiling which is continuously growing up demonstrate? The answer is Military Keynesianism (read ref 1, ref 2).

U.S. Local and State Government Public Debt
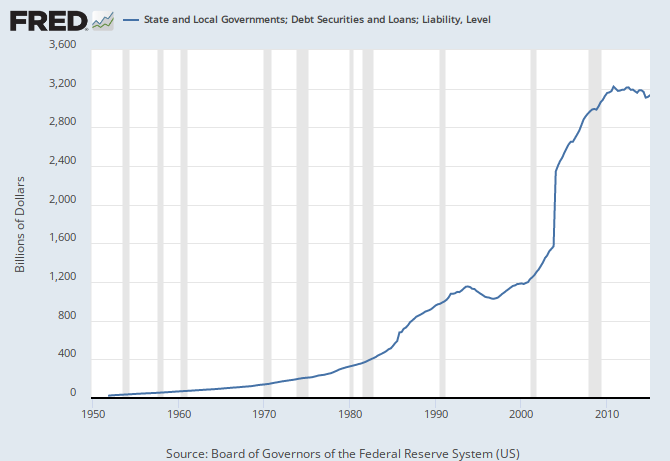
Updated quarterly ;
In 2012, this amount reached over US$ 3 Trillion.
Total Revolving Credit (1968-today)

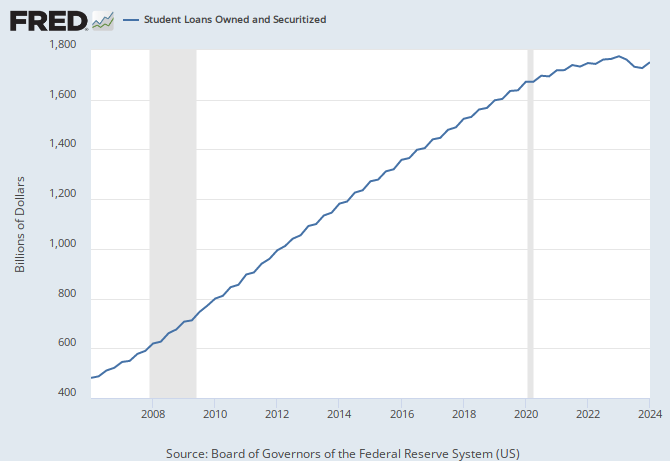

As explained here, delinquency rates for student loans are likely to understate actual delinquency rates because almost half of these loans are currently in deferment or in grace periods and therefore temporarily not in the repayment cycle. Among loans in the repayment cycle, delinquency rates are roughly twice as high.
Bank of America Research - Merryl Linch released in september 2012 a full report on this subject : summary here.
Bank of America Research - Merryl Linch released in september 2012 a full report on this subject : summary here.
- Debt burden taken on by U.S. colleges and universities (2001-2011) :

2. United States GDP and Debt
Dollar increase in GDP (nominal) per 1$ increase in total U.S. Debt = Marginal productivity of Debt


Data serie between 1955 and Q2 2009; plots using a 4Q moving average; source

Same ratio without using a moving average (blue, lhs) ;
y/y increase in GDP (green, rhs); y/y increase in Total Public Debt (red, rhs); data series since 1948; updated quarterly


Idem; 10-Year moving zoom; updated quarterly
Data serie since 1951; updated quarterly
Total credit market debt owed over GDP (in %, annual) between 1870 and 2009

Forms of Debt (%GDP, Adjusted): Total Credit Market Debt, Private Debt, Public Debt; Data serie 1916-2008; Source
Real GDP (rhs), Total Public Debt to real GDP ratio (lhs, % using billion of chained (2005) dollars); Data serie since 1966; updated quarterly
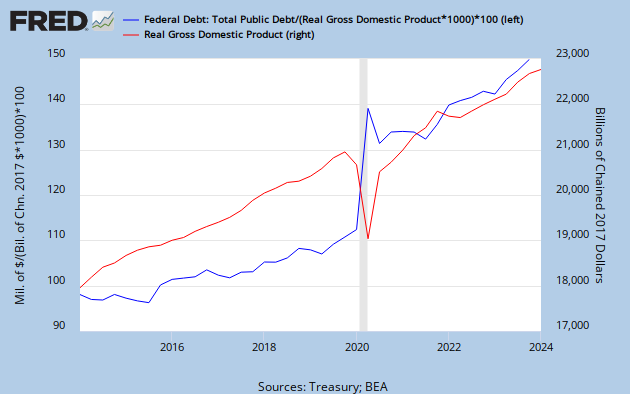
Same graph with a zoom on the last 10Y

Government's projection of public debt / GDP ratio, without using chained (2005) dollars (see also the comparison with others countries)
- see also U.S. Total Public Debt to GDP Ratio article explaining how to draw yourself this debt/gdp graph
U.S. Gross Public Debt (% GDP) since 1792
Zero Hedge has reused data from usgovernmentspending.com to produce this nice chart :

data serie between 1792 and 2012 ; Source: ZH
U.S. Federal, State and Local Gross Public Debt (% GDP) 1900 - 2016 cumulative data serie

bleu : Debt owed by State gov
red : Debt owed by Local gov
green : Debt owed by Federal government
source
source
- Main components of Gross Public Debt owed by Federal Gov. (% GDP), 1985-2016 :

bleu : Monetized Public Debt (Agencies...)
red : Public Debt Held (SSTS, etc)
green : Public Debt (Bonds, Treasuries...)

)%2Fb*100%2C(a-(d%2F1000%2Bc))%2Fb*100&fgst=lin%2Clin&fq=Annual%2CQuarterly&fam=avg%2Cavg&vintage_date=%2C&revision_date=%2C)


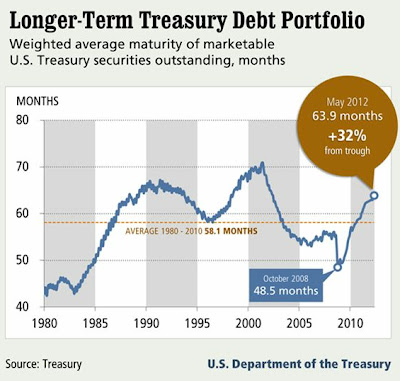
 Pyramis: Indeed, with recent issuance sizes and projected deficits, the Treasury is anticipating the average maturity of the portfolio to approach 80 months or 6.5 years by 2021.
 Black: US Securities; rose: Agencies + GSEs securities;

- Main components of Gross Federal Debt (% GDP) :

Data serie 1940-2012 and estimations till 2016; Source
U.S. Private Debt (% GDP)
Data series since 1950 and 1966; Updated yearly and quarterly
3. U.S. Debt holders
Who are the holders of the U.S. federal debt ?
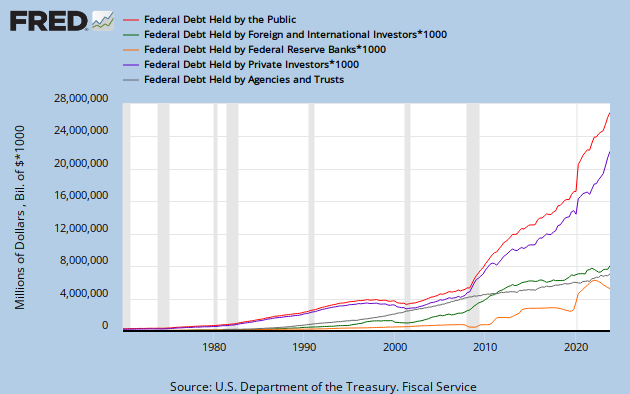
- Main holders of Federal Debt, 1970-today :
- for one part debt actually held by the private investors, pension funds, US state and local governments (FDHBPIN or FDHBPI, USD 10.6 trillion, blue line below) [this one is also including debt held by foreign & international investors like central banks (FDHBFIN or FDHBFI, USD 6.2 trillion, green line below)];
- and for the other part debt held by the Federal Reserve System (FDHBFRBN or FDHBFRB, USD 2.8 trillion, orange line below), i.e., monetized as part of the monetary base.
- It does NOT include “debt held by federal government accounts" (FDHBATN or FDHBAT, USD 5.1 trillion, grey line below), such as IOUs owed to the Social Security Trust Fund (> USD 2.7 trillion).
- Treasury Bulletin, updated quarterly, MS Word/pdf file format.
- The holders of the Gross Federal public debt in 2011 :
source: NYT, 07/2011

Chart source: Political Calculations; data as end of Sept. 2011
- U.S. Federal Debt Held by Federal Reserve Banks : see Fed's dashboard page.
Updated quarterly; in US$ bn
- Total Federal Debt held by foreign investors as % of gross federal debt (red) and over the GDP (blue) :
data series since 1970; updated quarterly
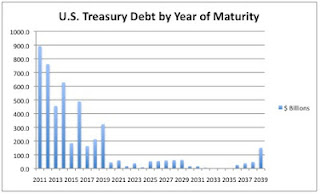
- UST debt portfolio by year of maturity :
snapshot 06/2012; source

 Pyramis: Indeed, with recent issuance sizes and projected deficits, the Treasury is anticipating the average maturity of the portfolio to approach 80 months or 6.5 years by 2021.
TIPS Contribution to Average Maturity :
Inflation-indexed securities have a greater duration than nominal securities given their inflation accretion component.
While 10-year nominal notes and 30-year bonds have durations of about 9 years and 20 years respectively, similar maturity TIPS have durations of about 10 years and 27 years.
These securities, especially the 30-year TIPS, have aided in the extension of the portfolio’s average maturity and added significant duration overall.
The holders of U.S. Treasury securities
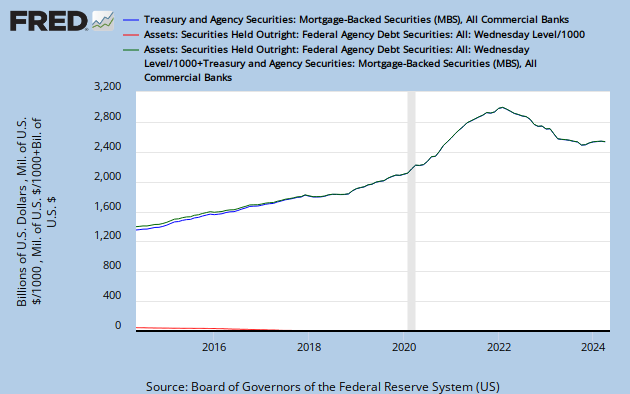
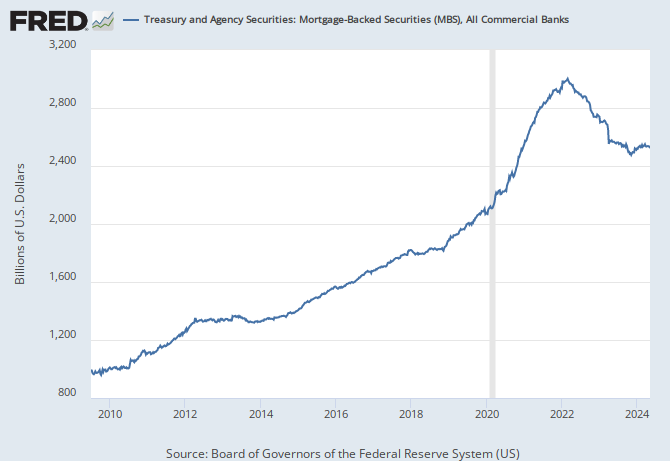
The holders of U.S. Agency Securities and Mortgage-Based Securities
red: MBS held by Fed; blue: held by all commercial banks; green: total ;
Updated weekly
Agency securities are liabilities of U.S. government agencies or U.S. government-sponsored enterprises (Fannie Mae, Ginnie Mae, Freddie Mac).
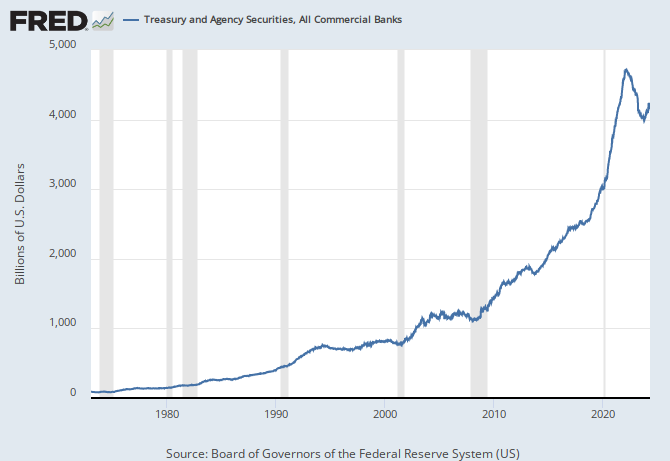
- Sum of Treasury and Agency Securities held by all commercial banks, 1973-today :
Updated weekly ; similar to USGSEC serie.
- MBS securities and Federal agency debt held by the Federal Reserve: see Fed's dashboard page

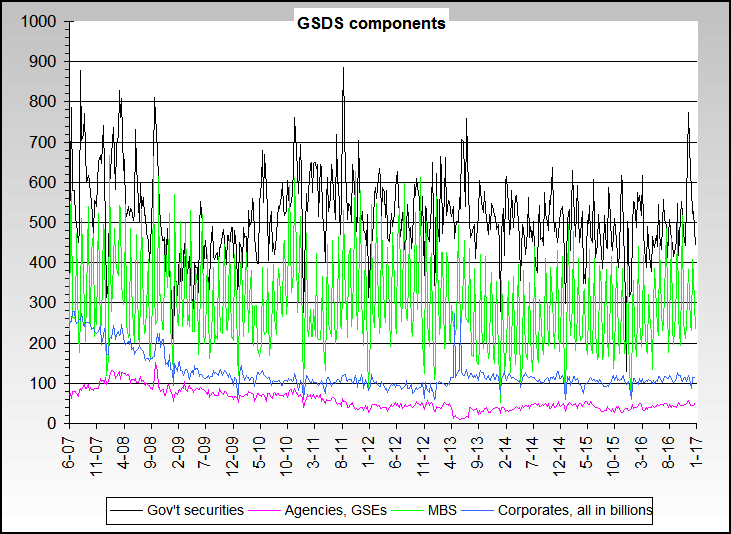
green: MBS; blue: corporate securities;
8Y data series ; updated weekly; in US$ bn

idem, annual change rates
Source for these last 2 charts: nowandfutures.com using Fed, Treasury data.
Excluding corporate equities and mutual fund shares.
Total credit market instruments assets, debt securities and UST held...
See this other page.
4. United States Debt: Trade and Budget Deficits, Defense spending
U.S. Budget and Trade Deficits

Annual Federal budget deficit; data series between 1879-1962; source

Annual Federal budget expenditures; data series between 1879 and 1962; source

data series since 1970, 1Y MA, updated monthly; source: nowandfutures.com
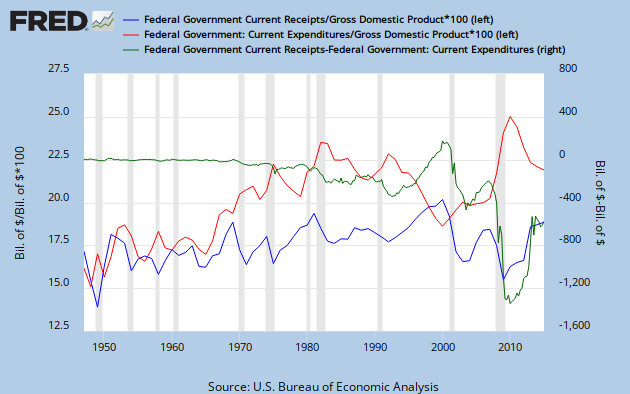
Federal expenditures and receipts As Percentages of GDP
data series since 1947, % of GDP ; updated quarterly
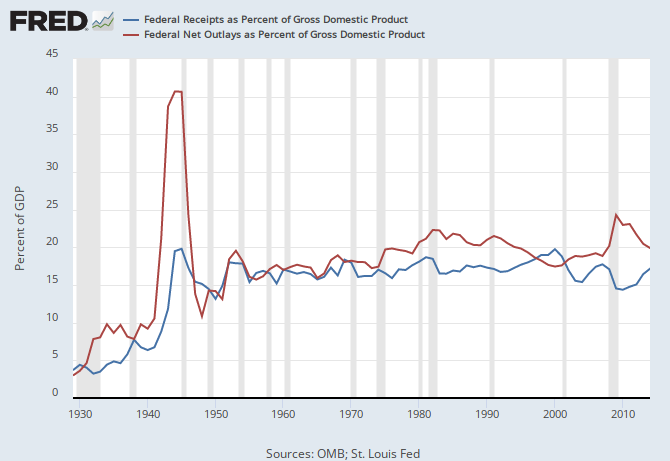
data series since 1929, % of GDP ; updated yearly
Federal Budget Surplus or Deficit As Percentages of GDP

Data serie between 1800 and 2011 and CBO projection to 2020;
Grey lines: CBO projections published in 2000, 2011
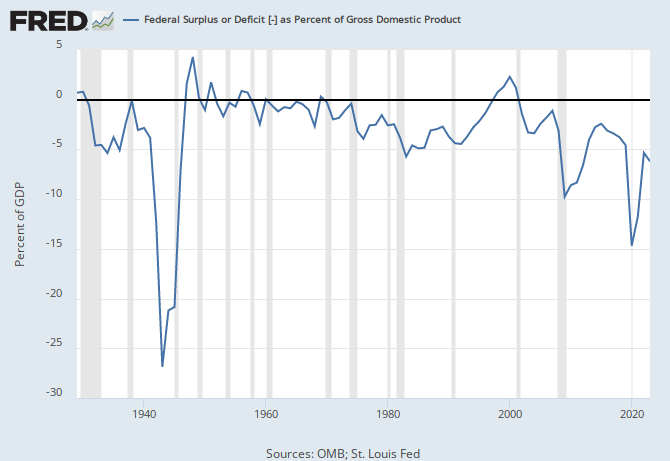
Data serie since 1929; updated yearly

U.S. Government spending and tax revenue per capita (2000-2011)

Government (F+S+L) Receipts and Expenditures per capita

data series since 1947, updated quarterly
Current Account Balance world heat map (U.S. $)
Government (F+S+L) Receipts and Expenditures
Federal Government Receipts and Expenditures
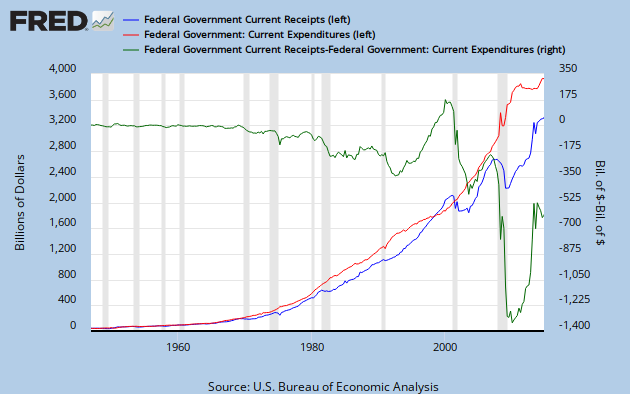
data series since 1947, updated quarterly
Local and State Government Receipts and Expenditures
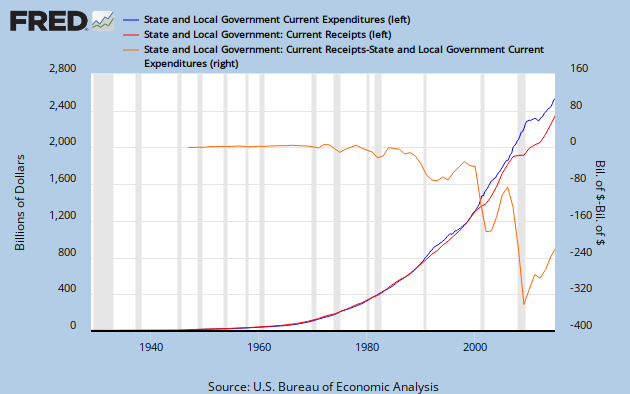
data series since 1929, updated quarterly and yearly
Federal Gov. Revenues as shares of GDP

United States Defense Spending


Data series 1950-2010
- Percentage of defense spending over the federal expenditures :
The left hand scale shows the difference between federal expenditures (blue) and net outlays (FYONET, red).
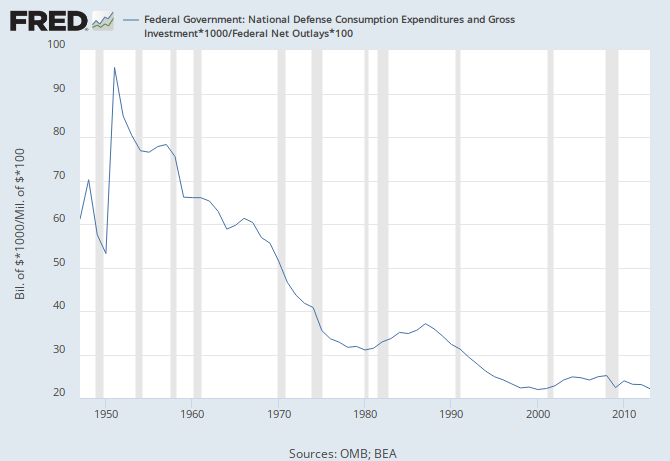
Data series since 1946, updated yearly;
Note the vertical left hand scale : bottom line is 20%, not 0%
You can browse the same chart from wikipedia, on a shorter period (please read carefully the small characters just below the chart).
- see also Federal National Defense Gross Investment since 1947 (USD 110 bn now) and Real National Defense Gross Investment (in billion of chained 2005 dollars) since 1995; updated quarterly
- Total U.S. active military personnel (excluding civilians and reserve personnel) :

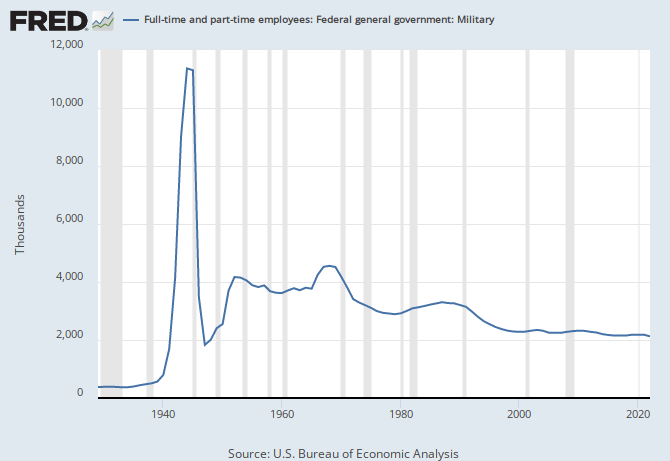
Federal government: military workforce; data serie since 1929, updated yearly
This total does not include workforce from Private military companies (PMCs) a.k.a Private Military / Private Security Companies or Contractor (PSC). According to a 2008 study by the Office of the Director of National Intelligence, private contractors make up 29% of the workforce in the United States Intelligence Community, and cost the equivalent of 49% of their personnel budgets.
As of October 2012, in Afghanistan, there were 18,914 PSC personnel working for DOD; in Iraq, there were 2,116 PSC personnel. The total number of DoD contractor personnel in USCENTCOM area of operations, Iraq and Afghanistan is over 137,400. Reported PSCs are only part of them. (Source : US Secretary of Defense)
As of October 2012, nearly five million people held government security clearances. Of that, 1.4 million held top-secret clearances. More than a third of those with top-secret clearances are contractors.
“The national security apparatus has been more and more privatized and turned over to contractors,” said Danielle Brian, the executive director of the Project on Government Oversight, a nonprofit group that studies federal government contracting. “This is something the public is largely unaware of, how more than a million private contractors are cleared to handle highly sensitive matters.”
- Number of persons with a national security clearance : source

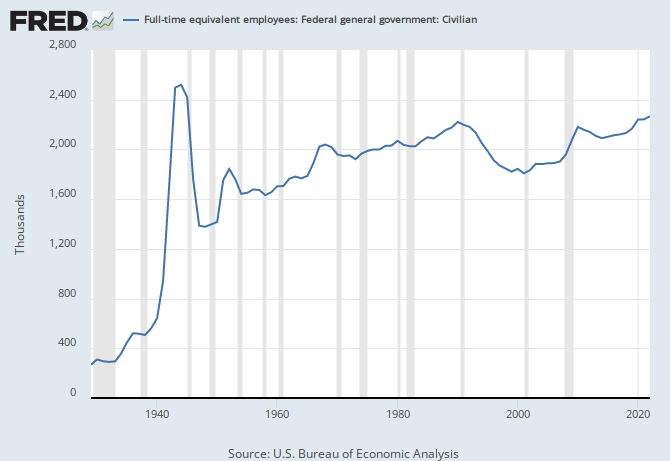
Full-time equivalent employees: Federal general government: Civilian ; data serie since 1929
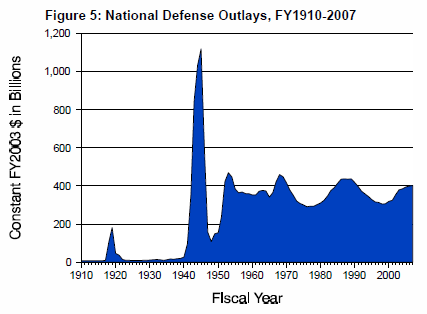
- U.S. Defense spending data serie using chained (2003) dollars, between 1910 and 2007 :
- U.S. Defense spending data serie (% GDP), 1792-2015 :

...to be compared with U.K. defense budget :
5. United States monetary policy and the international status of the U.S. dollar
See the U.S. Fed's dashboard page for details about :
- U.S. Money Supply
- Fed's holdings
- Fed's monetary policy
- How confident do the foreign central banks feel in the U.S. dollar international status?
Ce commentaire a été supprimé par l'auteur.
RépondreSupprimerCe commentaire a été supprimé par l'auteur.
RépondreSupprimerJacques Attali résume en peu de mots la situation des US dans son billet du 11 février. Il aurait simplement pu citer ses sources ;)
RépondreSupprimerThese graphs only shows that economic crisis is too powerful that even a strong country like US can suffer on this.
RépondreSupprimer@"World economics":
RépondreSupprimerI would precise more:
1) these graphs shows that the current crisis is too deep that the previously strongest country (US) is suffering a lot on this crisis
2) The US have never suffer such a deep and long crisis, even in 1930's
3) The US are not currently recovering from the crisis. None problems have been fixed.
4) The crisis is not limited to the economics in the US, it is now also political, social, and in a word: systemic. See others graphs here.
5) Because of the central position of US in the world order before this crisis, this is indeed a global systemic crisis, i.e. a crisis where the central position of the US (and the dollar) is very much challenged in the ongoing definition of the world order after the crisis.
Since end of March 2013, this page became the most viewed in the cumulative statistics since the beginning of this site (special dedicated pages are not taken into account in the "most viewed" widget at the left side, but only blog entries).
RépondreSupprimerThe amazing part of the story is that this blog is not any more referenced by Wikipedia since last december (after more than 2 years where many Conscience Sociale pages remained referenced, all references in more than 10 wikipedia pages were deleted), following a discussion about the addition of a new reference to this US Debt Dashboard page. Following this decision, this page disappeared into the depths of google search results.
The last addition was refused by some members of wikipedia community whereas this page only aggregates official sourced information.
So I do not know how visitors managed to find this page, but they found it !
If you find it useful for you, you may post its URL in your favorite social media.