..: Updated frequently :..
____________________________
Dashboard of the U.K. Debt and Economy
1. U.K. Debt
Public sector net debt in £ trillion
Public sector net debt, £ billion 2005 value
Total public spending, £ billion 2005 value
Public spending in debt interest, £ billion 2005 value
Public spending in Defence, £ billion 2005 value
Public net debt as a percentage of GDP

General government gross debt for United Kingdom (1980-2017, %GDP)


Who owns U.K. Public Debt ?


U.K. Public Debt held by overseas investors - 2003-2012

Foreign Japanese government bond (JGB) holdings were 9.1 % at the end of September 2012.
At the end of 2011, 45 % of U.S. Treasury bonds were owned by foreigners, while the comparable figure for U.K. Gilts was 32 %.
U.K. Private and Public Debt as % of GDP , 1987-2009

Bank of England : total assets
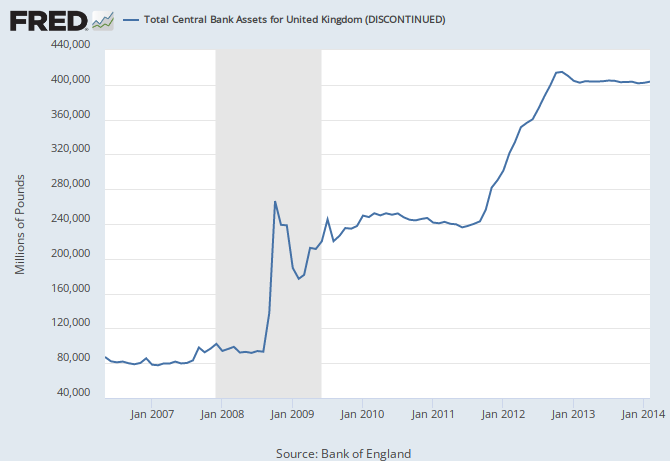
Total assets (discontinued)

M0 comprises notes and coin in circulation outside the Bank of England, plus bankers' operational balances with the Bank of England. M4 comprises notes and coin in circulation outside the Bank of England and banking institutions in the U.K., plus non-bank private sector sterling deposits held with U.K. banking institutions. Beginning July 2009, this serie refers to M4 excluding intermediate OFCs (M4ex)(http://www.bankofengland.co.uk/mfsd/iadb/notesiadb/m4adjusted.htm). M4 differs from Money plus Quasi-Money (line 35l) because it excludes private sector foreign currency deposits, and sterling and foreign currency deposits of official entities (local authorities and public enterprises).


Chart source: BBC
Data serie since 1971
2. Macroeconomic indicators for the U.K.
GBP - Euro exchange rate
Data serie since 1999
GBP - U.S. dollar exchange rate (1971-today)

U.K. GDP and inflation
- U.K. GDP (% change), by quarter, 1955-2012 (Source : The Guardian)
- U.K. GDP

UK Real and nominal GDP, 1960-2013

UK Real GDP per capita and Retail Price Index inflation rate, 1265-2009;
source: MeasuringWorth

U.K. banking assets as a percentage of GDP

Source: Azizonomics
U.K. industrial production

% change YoY; data serie since 1949
U.K. 10 year Bond Yield

UK short and long-term interest rates, 1729-2011;
Source: MeasuringWorth.com
Aucun commentaire:
Enregistrer un commentaire